MECHANISM OF EVOLUTION
● Even though `color{Brown}"Mendel"` had talked of `color{Violet}"inheritable factors "`influencing phenotype, `color{Brown}"Darwin"` either ignored these observations or kept silence.
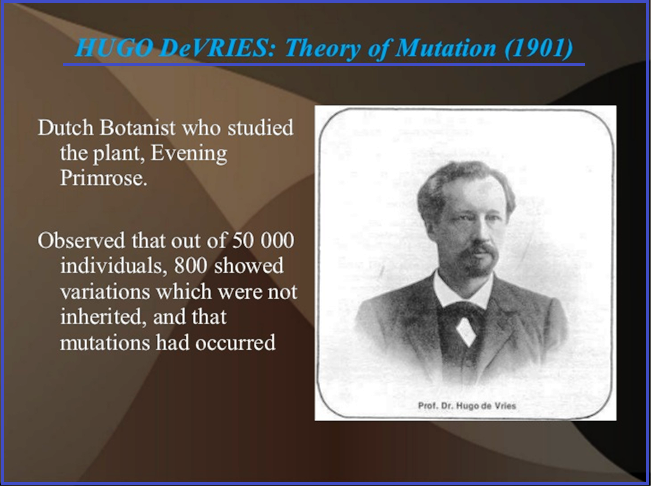
● In the first decade of `color{Violet}"twentieeth century"`, `color{Brown}"Hugo deVries"` based on his work on `color{Violet}"evening primrose"` brought forth the `color{Violet}"idea of mutations"` – large difference arising suddenly in a population.
● He believed that it is `color{Violet}"mutation"` which causes evolution and not the `color{Violet}"minor variations""` (heritable) that Darwin talked about.
● Mutations are `color{Violet}"random"` and `color{Violet}"directionless"` while Darwinian variations are `color{Violet}"small and directional"`.
● Evolution for Darwin was `color{Violet}"gradual"` while deVries believed `color{Violet}"mutation caused speciation"` and hence called it `color{Salation}"saltation"` (single step large mutation).
● Studies in `color{Violet}"population genetics"`, later, brought out some clarity.